.svg)
%201.svg)

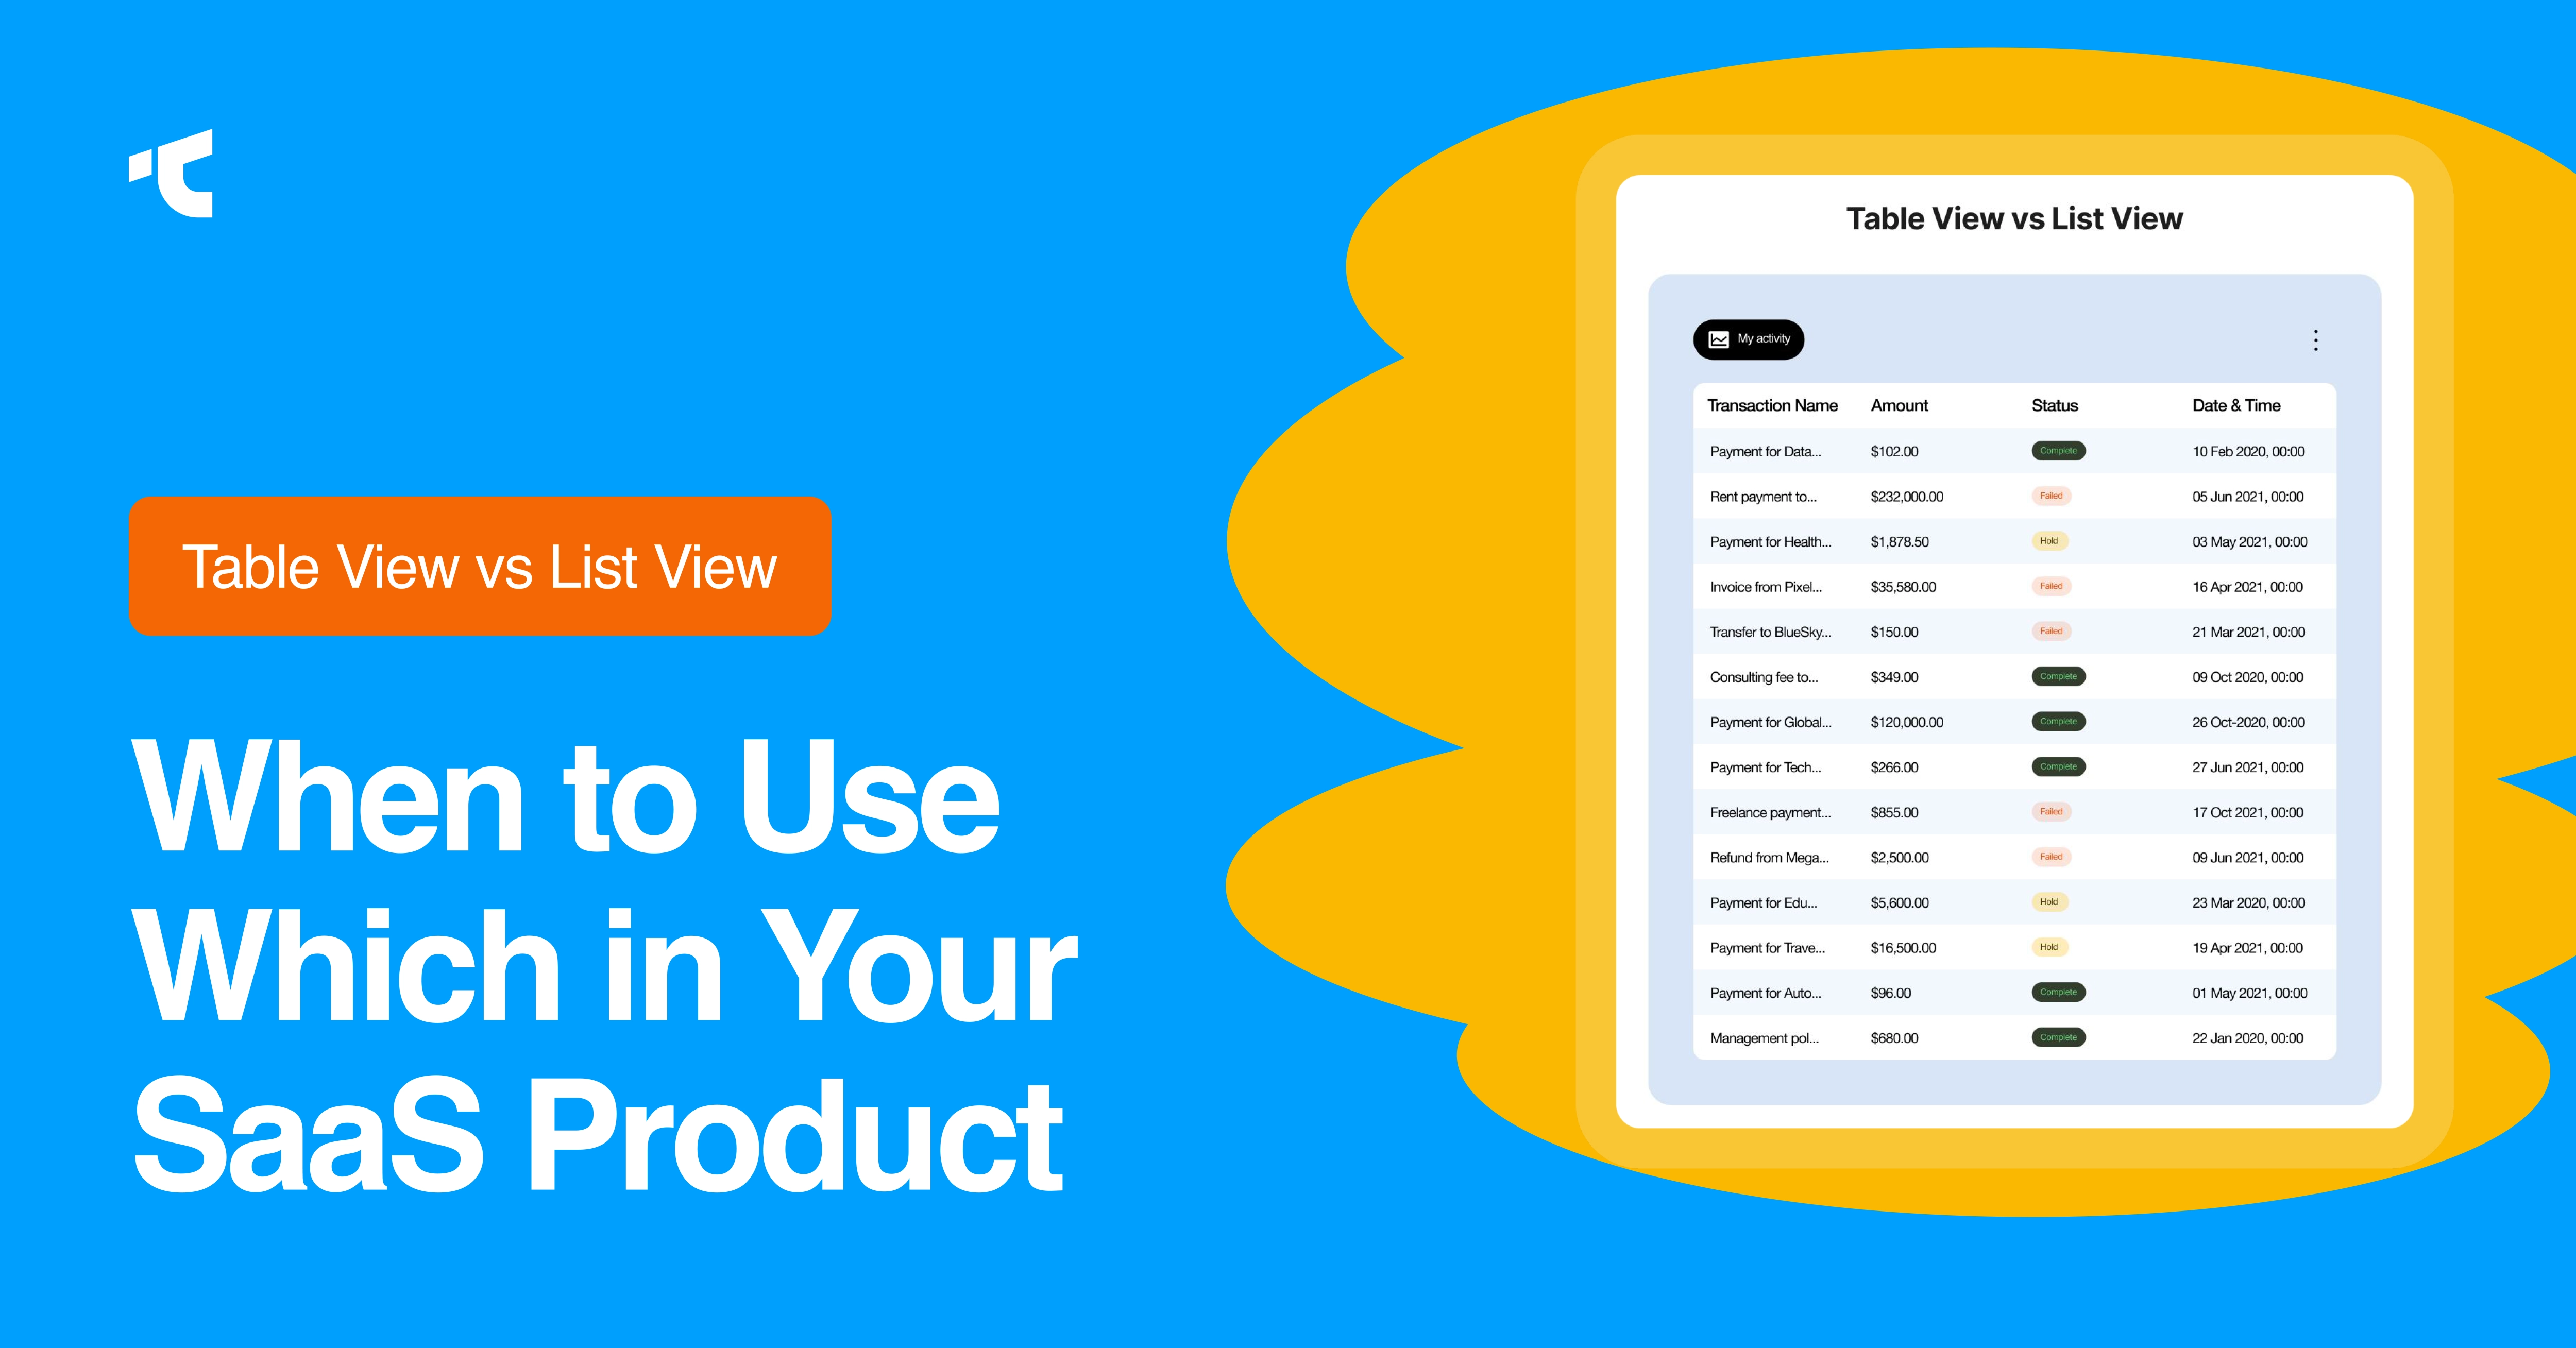
Table view and list view are the two data display patterns your users interact with more than any other screen in your SaaS product, more than your homepage, more than your onboarding flow.
And yet most founders treat this as a styling choice. Something to fix later. Meanwhile, they obsess over landing pages that users see exactly once.
Here's the uncomfortable math: B2B SaaS companies lose an average of 38% of customers annually. Most of it isn't pricing. It isn't missing features. The quiet killer is preventable friction, confusing workflows that make people put in too much effort. Users don't write angry tickets about bad table design. They just stop logging in.
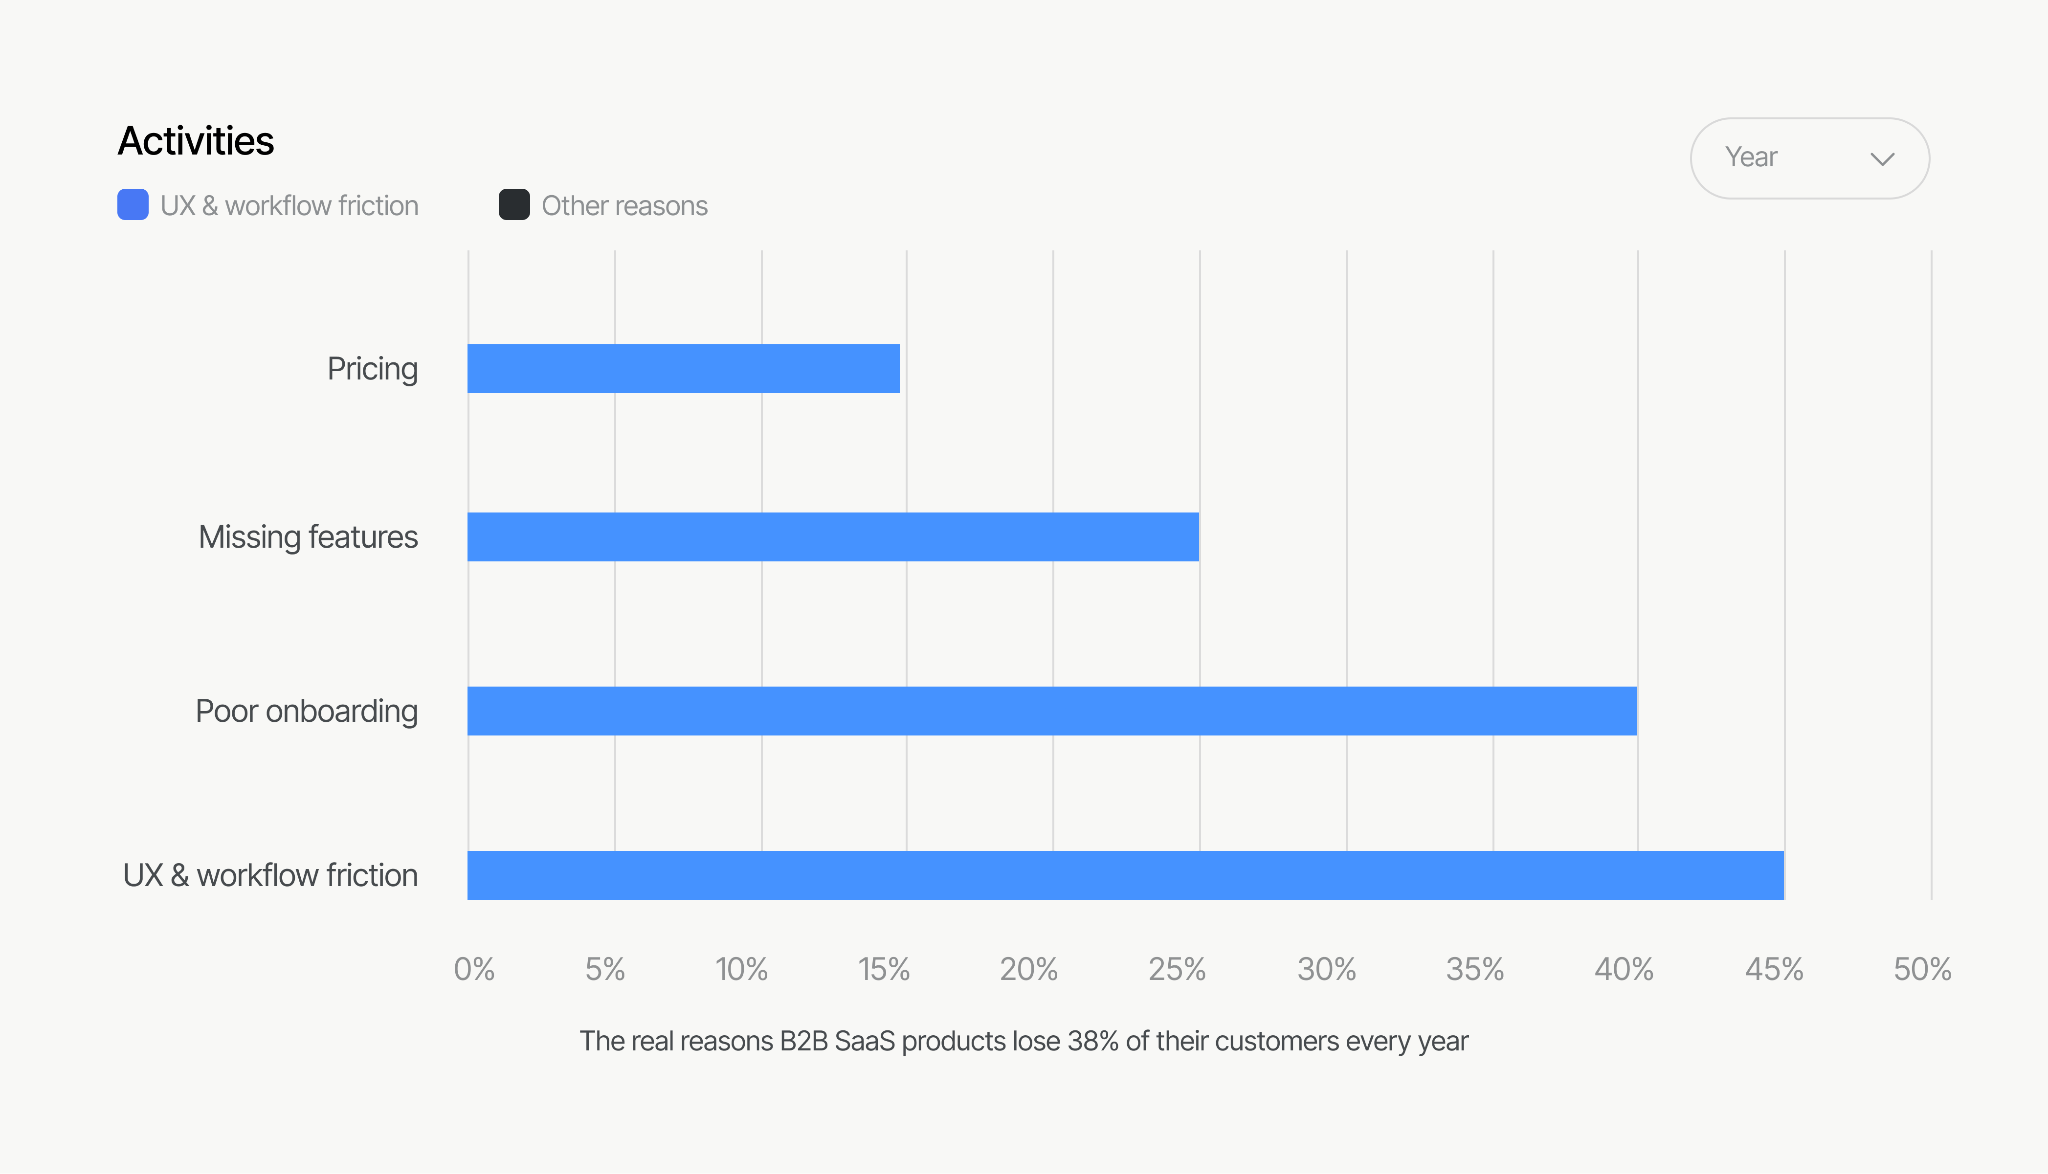
We've audited 29 SaaS products to know: this decision alone shows up in activation and D30 retention more than most founders expect.
This post breaks down the table vs list view decision, when to use which, and how each choice connects to the metrics you actually report to investors: activation, retention, and expansion.
How You Display Data Is a Business Decision, Not a Design One
Think about what a user does every time they log back into your product. They scan. They compare. They filter. They act. Every single one of those tasks depends on how your data is laid out on screen.
When the layout works, users find what they came for in seconds. They come back tomorrow. They build a habit.
When it doesn't, every session gets a little harder. An extra scroll. A column that makes no sense. A filter that resets itself. No single moment breaks anything. But after a few weeks of this, the user quietly decides your product feels clunky — and starts looking at a competitor.
This is why how you display data shows up in your numbers before it shows up in your inbox:
Signups who never come back: A new user who can't figure out your default screen in the first 60 seconds never hits the moment where your product clicks for them. They don't leave because of missing features. They leave because the screen confused them.
Users who stop logging in: If completing one basic task takes 9 clicks instead of 3, users don't complain. They just open it less. Then they stop.
Support tickets: Confusing screens generate "how do I find..." tickets. Every one of those tickets is a layout problem dressed up as a support request.
Users who never upgrade: Your most active users hit a wall when they can't edit records in bulk, save a custom view, or sort the way they need to. They don't ask for more. They just stop growing with you.
When should you use a table view vs. a list view?
Across our 29 SaaS UI UX audits, this is the pattern we found: a table got picked because the data "felt like a spreadsheet," or cards got picked because a competitor's product looked modern. Both are gut calls, not design decisions.
The right question is: what is the user's job on this screen?
When is a table view the better choice for SaaS UI UX?
Tables exist for one reason: comparing attributes across many items at once. If your user needs to scan 50 rows and answer "which deals are stalled?" or "which accounts are over their usage limit?", a table is the only honest answer. Dense, structured, sortable.
Tables win when:
- Users compare multiple attributes side by side (status, owner, value, date)
- Sorting and filtering are core to the workflow
- The dataset is operational: orders, invoices, tickets, user accounts
- Users are on desktop, doing focused work
When is a list view the better choice for your SaaS product?
List views exist for one thing: moving through items one by one, top to bottom. Not comparing across them, just processing them in order. Inboxes, activity feeds, task lists, notifications.
List views win when:
- Users process items in order rather than comparing across them
- Each item has a clear primary attribute (a title, a sender, a task name)
- Mobile usage is significant; lists survive small screens; tables don't
- The next action is per-item (open, archive, complete), not cross-item
When can you use table view and list view both?
Most mature SaaS products end up offering both; Linear lets you flip between list and board, Notion between table and gallery, ClickUp between everything and everything else. But notice: each of those products launched with one opinionated default that matched their core user's primary job. The view switcher came later, after the core workflow was proven.
If you're pre-scale, don't build a view switcher. Build the one view that matches the job, and make it excellent. A view switcher at $8K MRR is a feature that hides an unmade decision.
How do you design a table view in SaaS that users actually want to use?
These are the seven table design decisions that separate a product users tolerate from one they rely on daily.
1. Column discipline. Every column you add to your SaaS, it increases scan time for every row, and audit your default view: if a column isn't needed for the primary task, move it behind a "customize columns" control. We suggest for best-performing SaaS tables we ship default to 5–7 columns, not 15.
2. Lock the first column in place. When users scroll right, the record name or ID must stay visible. The moment they lose track of which row they're on, they stop trusting the screen. That's when they hit Export to CSV and finish the job in Excel. Every CSV export is a user telling you your table didn't work.
3. Left-align your text, right-align your numbers. Keep date formats consistent across every row. This feels like a small thing. It isn't. When your number columns don't line up, users can't compare them at a glance, and comparison is the only reason they're on this screen.
4. Keep your column headers visible at all times. When a user is 200 rows deep and can't remember what column 6 means, they scroll back up, lose their place, and get frustrated. That frustration compounds across every session. Don't make them work to remember what they're looking at.
5. Use pagination, not infinite scroll, on your data tables. Infinite scroll works for social feeds where losing your place doesn't matter. Your orders, invoices, and user lists are not a social feed. Give your users a rows-per-page control and page numbers. When someone loses their place in a 2,000-row table, they don't try again; they leave.
6. Add bulk actions before your power users ask for them. The moment a user thinks "I need to update these 30 records one by one," your product stops feeling professional. Multi-select with bulk edit is one of the most deferred features we see in SaaS audits — and one of the most felt when it's missing.
7. Never leave your new users staring at a blank table. Their first session is your best chance to show them what your product can do. Use that empty screen to show what a populated table looks like, and give them one clear action to get started. A blank grid tells them nothing. Don't waste that moment.
How do you design a list view in SaaS that users actually want to use?
Visual hierarchy inside each item. A list item needs one primary attribute the eye lands on, with secondary metadata visibly subordinate, smaller, lighter, beneath. If everything in the row is the same weight, scanning speed dies and the list becomes a worse table.
Status at a glance. Color-coded status indicators let users triage a list without reading it. This is the difference between a 10-second session and a 2-minute session, and for daily-use tools, faster sessions correlate with higher return frequency, not lower.
Per-item actions where the thumb expects them. Swipe actions on mobile, hover actions on desktop. Forcing users into a detail view for every small action multiplies clicks across thousands of sessions.
Density options for power users. Comfortable spacing for new users, compact mode for the user who lives in your product eight hours a day. Gmail figured this out fifteen years ago; most B2B SaaS still hasn't.
How to Diagnose Your Current Data Views
You don't need a redesign to find out whether your tables and lists are hurting you. You need 30 minutes in your analytics. If you have PostHog, Mixpanel, or Hotjar installed, and you almost certainly do- look for these signals:
- Rage clicks on column headers. Users expect headers to sort. If session replays show repeated clicks on non-sortable headers, you've found a broken expectation.
- Horizontal scroll abandonment. Watch sessions where users start scrolling sideways and then leave the page. That's a column-count problem.
- Filter usage vs. filter abandonment. If users open your filter panel and close it without applying anything, your filter UX is more complicated than the question they were trying to answer.
- Export frequency. A spike in CSV exports usually means users trust your data but not your interface for working with it.
- Time-to-first-action on data screens. If returning users take 40+ seconds before their first click on a dashboard table, they're searching, not working.
Run that audit before commissioning any design work, from us or anyone else. The fix should follow the data, not the other way around.
The Mistakes We See in Almost Every Audit
- Defaulting to a table because the database has columns, without asking what the user's job is
- 12+ columns visible by default, with the important one in position 9
- Borders around every cell, producing a spreadsheet from 2009
- Infinite scroll on operational data, making specific records unfindable
- No empty state design — new users meet a blank grid and bounce
- A view switcher was shipped instead of a decision made
- Mobile "support" that means pinch-zooming a desktop table
None of these are exotic problems. All of them are invisible to the founder who built the product, because the founder already knows where everything is. Your users don't.
Final Word
The table vs list view choice is not a polish task you get to after growth. It is the surface your retention curve is drawn on. Users form their opinion of your product not on the homepage but in the four hundred small moments of finding, comparing, and acting on their data, and every one of those moments is a design decision someone either made deliberately or made by accident.
If your D30 retention is flat and your analytics can't tell you why, your data views are one of the first places to look. The signals are already sitting in your session replays.
Does my table design actually affect churn?
Yes, directly affect in SaaS churn rates. Poor table UX creates session-level friction, extra scrolls, wrong sorts, lost records. No user files a complaint about it. They just stop logging in. Your D30 curve reflects it before your inbox does.
Can I just offer both table and list view with a toggle?
Only after your core view is proven. A toggle at $8K MRR hides an unmade decision. Ship the one view that matches your users' primary job. Make it excellent first. Add the switcher later.
My users are complaining the dashboard feels overwhelming; is that a table problem?
Usually, yes. Too many default columns, no visual hierarchy, and missing filters make tables feel like walls of data. If users can't find what they came for in seconds, the table design is the problem.
How many columns should a default table view show?
Default to 5 to 7 columns maximum. Every column beyond that increases scan time for every row. Move non-essential columns behind a "customize columns" control. The most important column should always appear first.
What does a good empty state look like for a table?
Never show a blank grid. Show a preview of what the populated table will look like, explain what the data means, and give one clear action to fill it. Your first empty state is your best onboarding moment.
Should my SaaS support mobile table views?
Not with a full desktop table. On mobile, strip columns down to 2 to 3 essentials, stack rows into card-like items, and add horizontal scroll with sticky headers only if comparison is truly needed. Lists almost always serve mobile users better.
Let's work together
If you want a second set of eyes on your product's data views, we run structured SaaS audits that connect design decisions to the metrics you're trying to move. No pitch deck, no Figma walkthrough, a diagnostic with numbers. Get in touch.


.avif)